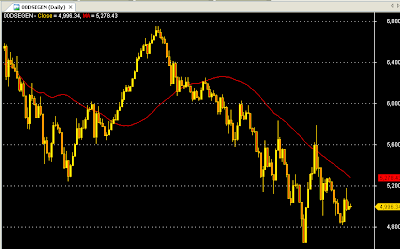
We already know how to add price through bar or candlestick. Today, we will add Moving Average in our chart.
We can add Moving Average in our chart just by adding below one line code :
Plot (MA(Close,50), "MA", colorRed);
If we add moving average in our chart then our complete code will be
/*

-------------------------------

I'Ve written this Code for the

purpose of my blog writing.


Date : December 18, 2011

-------------------------------

*/


_SECTION_BEGIN("Price");

//The below code will display the price through candlesticks

Plot( Close, "Close", ParamColor("Color", colorGold), ParamStyle("Style", styleCandle, maskAll));

_SECTION_END();


_SECTION_BEGIN("Moving Average");

//Below code will display 50 days simple moving average line

Plot (MA(Close,50), "MA", colorRed);

_SECTION_END();


//-----------------------------
Pls. copy the above complete code and paste it in your Formula Editor and display the chart. I hope your chart looks like (if you select DSE General Index) :
Isn't easy??? Yeah, very simple. If you read my previous lessons, I know you can able to explain every word of the code. Okay, now I'll explain the new code that I've added in this lesson.
Syntax :
Plot (MA(Close,50), "MA", colorRed);
Meaning : Hello, I'm Plot() function. My job is display something in the chart. But I need some information from you. Please give me some specific information so that I can able to display as per your desire.
Syntax :
Plot (MA(Close,50), "MA", colorRed);
Meaning : Ques : Okay, My first question is What will be displayed? Ans : MA() i.e. moving average will be displayed.
Syntax :
Plot (MA(Close,50), "MA", colorRed);
Meaning : Ques : Understood. Moving Average will be displayed by me. But where is my data? Ans : Close price of a share is your data. I'm not telling you to do average of Open price, Low price or High price. I'm telling you only Close price.
Syntax :
Plot (MA(Close,50), "MA", colorRed);
Meaning : Ques : How many days of data will I take to do average? Ans : 50 days only.
Syntax :
Plot (MA(Close,50), "MA", colorRed);
Meaning : Ques : Okay, give a name of the product. You may give a name like "Jodu", "Modu", "Kodu". Ans : No no no. Its name is "MA".
Syntax :
Plot (MA(Close,50), "MA", colorRed);
Meaning : Ques : What will be the color of the product? Ans : My choice is Red.
Isn't easy? Really, programming is very easy if you understand it.

until few hours back i was thinking that, writing AFL was so tough, you made it so easy for me.. you explained it so very well in simple language, great job, god bless you, Thankyou
ReplyDelete