Tuesday, May 28, 2013

Heidelberg Cement formed Cup and Handle pattern

As a part of our learning - Cup and Handle pattern, Support-Resistance and Pullback, today we will discuss the chart of Heidelberg Cement (HEIDELBCEM). Before start please see the below chart first:

Heidelberg Cement (HEIDELBCEM), May 28,  2013
Heidelberg Cement (HEIDELBCEM), May 28,  2013

Heidelberg Cement has formed a Cup and Handle chart pattern, indicated as A. We have drawn a Resistance line, indicated as Line - R. We have also drawn a average volume line, indicated as V. 

After forming a successful Cup and Handle pattern, usually, price goes to up. The cup has already formed. Now, the handle is forming. Low volume is also giving a support to form a successful Handle. If everything goes fine, then there is a strong chance for uptrend and price may hit the resistance level at 290. 

Sometimes handle formation takes long time. Price fall with large volume during handle formation time, it's a broken handle. I have drawn a blue line which is our support line. It will help us to identify the broken handle. Handle is another type of Pullback.

The bottom line is - Volume is the king. Present low volume is positive for handle formation. But large volume will be required when it breaks the top of the cup.

DSE General Index finds its support line.

As a part of our Breakout, Support-Resistance and Trend Line learning, today we will discuss the chart of Dhaka Stock Exchange (DSEGEN Index). Before start please see the below chart first:
DSE General Index, May 27, 2013

After forming a double bottom, indicated as Oval, the DSE General Index broke its first resistance with large volume, indicated as R1. Then DSEGEN Index also broke the second resistance with large volume, indicated as R2. 

After forming a bearish candle, (pls. see the last apex candle), DSE General Index has stated to fall. We've got a green candle after consecutive 3 red candles. I have drawn a resistance line, indicated as Line R and a support line, indicated as Line S. Last green candle helps us to draw this support line.

I have also drawn a average volume line, indicated a Line V that indicated a very poor volume.

The  bottom line is - Market needs some fresh money to hold this sell pressure. We are near the ending point of Support and Resistance. So, any time we can see a Breakout or a Breakdown.


Square Pharma is testing its resistance.

As a part of our Breakout, Trend Line and Relation between volume and price learning, today we will discuss the chart of Square Pharma (SQURPHARMA). Before start please see the below chart first:

Stock chart of Square Pharma, May 27, 2013
Square Pharma, May 27, 2013

Recently, Square Pharma broke its initial resistance with large volume, indicated as Line A. Now, it's testing its another resistance line, indicated as Line B. Line B is a very strong resistance. It may test again and again as previous. To analyse a share, it's a good side we identify its resistance and support.

Now, we need to find the support line. We know that after a resistance breakout, it creates a support. In simple word, when a resistance breaks, it acts as a support. Now the Line A is our support line. I have also drawn another trend line as Support, indicated as Line C. The end point of Line A and Line C is our support zone, indicated as oval.

Our last and the most important indication is Volume. The volume is still below our average line, indicated as D.

The bottom line is - It's not necessary that the resistance line B will be tested again and again and price will come to our support zone, oval, to make our analysis 100% right. Resistance line B may break with good volume or the support line C may break down. Please keep in mind that Support or Resistance is create to break itself.

Monday, May 27, 2013

Chart Reading : Lesson - 4 (Part : 2): Pullback

In our last lesson, we discussed regarding the Breakout trading system. No trading system is 100% accurate. To follow the Breakout, sometimes you may caught by the Fake-out. How can we overcome this. We can overcome this by Pullback trading system.
Buy at 1st Pullback after a breakout.
Okay, Let's see the chart.
Pullback
Pullback
After a breakout, if you find a Higher Low (HL), yes, it's a Pullback. Buy at 1st Pullback after a breakout. Always try to catch the 1st Pullback. If you miss the first one then you may get more breakouts as well as pullbacks but you may compromise with profit.
Please keep in mind that Lower Low (LL) is not a pullback. If a Higher Low (HL) can not resist, then you will see a break down.
Which trading system should follow? Breakout? or Pullback? Ask it to your money management policy. It's not a bad idea if you use the both policy. Some money for Breakout and some money for Pullback and Some money for...... I will share you later.

Saturday, May 25, 2013

AFL Code Writing : Lesson 3 (Part 4)

Returned from the hibernation.

In our last tutorials we show you how to add simple moving average in your chart. We also learnt that how to make the moving average more dynamic for our user. Today, I will show you how to write moving average crossover.

Now, we will recall our last simple moving average code:

_SECTION_BEGIN("Moving Average");
//Below code will display 50 days simple moving average line
Plot (MA(Close, Param("Periods", 50, 2, 300)), "MA", ParamColor("Color", colorRed), ParamStyle("Style", styleThick));
_SECTION_END();

Today, we will see a moving average crossover between 10 days moving average and 30 days moving average. We already have code for moving average. We will use it. I have just copied the above moving average code 2 times as follows:

_SECTION_BEGIN("MA 30");
//Below code will display 30 days simple moving average line
Plot (MA(Close, Param("Periods", 30, 2, 300)), "MA", ParamColor("Color", colorRed), ParamStyle("Style", styleThick));
_SECTION_END();

_SECTION_BEGIN("MA 10");
//Below code will display 10 days simple moving average line
Plot (MA(Close, Param("Periods", 10, 2, 300)), "MA", ParamColor("Color", colorBlue), ParamStyle("Style", styleThick));
_SECTION_END();


I have made the following changes on our above two moving averages:
  • I have given separate names for our two moving averages. One is MA 30 and another one is MA 10. MA stands for Moving Average.
  • I have changed 50 days to 30 days and 10 days.
  • I have also changed the 10 days moving average color from from red to blue as our both moving average color were same.
Now, our final code for the two moving averages crossover as follows:
/*
-------------------------------
AFL code writing for moving average cross-over.
Date : May 25, 2013
-------------------------------
*/

_SECTION_BEGIN("Price");
//The below code will display the price through candlesticks
Plot( Close, "Close", ParamColor("Color", colorGold), ParamStyle("Style", styleCandle, maskAll));
_SECTION_END();


_SECTION_BEGIN("MA 30");
//Below code will display 30 days simple moving average line
Plot (MA(Close, Param("Periods",30, 2, 300)), "MA", ParamColor("Color", colorRed), ParamStyle("Style", styleThick));
_SECTION_END();


_SECTION_BEGIN("MA 10");
//Below code will display 10 days simple moving average line
Plot (MA(Close, Param("Periods", 10, 2, 300)), "MA", ParamColor("Color",colorBlue), ParamStyle("Style", styleThick));
_SECTION_END();

//-----------------------------

Allah Hafiz

Thursday, December 22, 2011

AFL Code Writing : Lesson 3 (Part 3)

Today we will make our simple moving average more dynamic. By the below code, our user is able to change the color and style of the moving average line without changing the code each time :

//Below code will display 100 days simple moving average line
Plot (MA(Close,100), "MA", ParamColor("Color", colorRed), ParamStyle("Style", styleThick));


But your user is not able to change the period dynamically. Like s/he would like to see the 50 days simple moving average. S/he needs to change the code. BTW, we can solve the problem by Param() function. Pls. see the below modified line of our simple moving average :

//Your user will be able to change the periods without changing the code
Plot (MA(Close, Param("Periods", 50)), "MA", ParamColor("Color", colorRed), ParamStyle("Style", styleThick));


By right button clicking or pressing Ctrl+R on the chart, your user is able to change the periods of moving average as per their desire. Pls. see the below image :


By dragging the bar, your user will be able to change the periods without changing the code. If you still confused please see the below explanation image :


Syntax :  Param("Periods", 50)
Meaning : By writing Param(), we are telling that it will be added in Parameters... so that our user can change the value without changing the code each time . "Periods" is name and 50 is default value.

Please keep in mind that by default Minimum value is 0 and Maximum value is 100. That is your user will be able to see the 0 to 100 days simple moving average. If s/he wish to see the 200 days moving average, s/he will not able to see it. Okay, we will give him/her a power to see upto 300 days simple moving average by the below code :

//Your user will be able to see 2 to 300 days simple moving average
Plot (MA(Close, Param("Periods", 50, 2, 300)), "MA", ParamColor("Color", colorRed), ParamStyle("Style", styleThick));


Syntax :  Param("Periods", 50, 2, 300)
Meaning : Here 2 is the minimum value and 300 is the maximum value.

Below is the our upto date complete code :

/*
-------------------------------
I've written this Code for the
purpose of my blog writing.

 Date : December 21, 2011
-------------------------------
*/

_SECTION_BEGIN("Price");
//The below code will display the price through candlesticks
Plot( Close, "Close", ParamColor("Color", colorGold), ParamStyle("Style", styleCandle, maskAll));
_SECTION_END();


_SECTION_BEGIN("Moving Average");
//Below code will display 50 days simple moving average line
Plot (MA(Close, Param("Periods", 50, 2, 300)), "MA", ParamColor("Color", colorRed), ParamStyle("Style", styleThick));
_SECTION_END();

//-----------------------------


Allah Haifz.

Wednesday, December 21, 2011

AFL Code Writing : Lesson 3 (Part 2)

Today, we will give more power to our afl user. Our user will be able to change the color and style of moving average line without editing the code. But how? Let's see

By the below code, our user will not able to change the color through Parameters... (Right click on the chart and you will find the Parameters...). Because our below code is not dynamic. If our user wants to change the color of line s/he needs to change the code.

//Below code is not a dynamic code
Plot (MA(Close,50), "MA", colorRed);


But how can make our code dynamic so that our users can change the color as their desire without changing the code every time? It's easy. You have done this before. Just remember it. If you can't remember, don't worry. Just see the below code.

//Now our user will able to change the color of line dynamically
Plot (MA(Close,50), "MA", ParamColor("Color", colorRed)
);

By adding ParamColor(), we have given power to our user to change the color through Parameters without changing the code. But our above code is not fully dynamic because our user is not able to change the line style dynamically.

//Now our user will able to change the line style dynamically
Plot (MA(Close,50), "MA", ParamColor("Color", colorRed), ParamStyle("Style", styleThick));


In a previous lesson, I explained the ParamColor() and ParamStyle(). So, I'm not going to explain it again. Below is the upto date complete code :

/*
-------------------------------
I've written this Code for the
purpose of my blog writing.

Date : December 20, 2011
-------------------------------
*/

_SECTION_BEGIN("Price");
//The below code will display the price through candlesticks
Plot( Close, "Close", ParamColor("Color", colorGold), ParamStyle("Style", styleCandle, maskAll));
_SECTION_END();


_SECTION_BEGIN("Moving Average");
//Below code will display 50 days simple moving average line
Plot (MA(Close,50), "MA", ParamColor("Color", colorRed), ParamStyle("Style", styleThick));
_SECTION_END();

//-----------------------------


In our next lesson, I'll show you how can we make our moving average code more dynamic. Some of my friends are eager to see the moving average cross over. Don't worry. I'll explain it. Allah Hafiz.

Sunday, December 18, 2011

AFL Code Writing : Lesson 3 (Part 1)


We already know how to add price through bar or candlestick. Today, we will add Moving Average in our chart.

We can add Moving Average in our chart just by adding below one line code :

Plot (MA(Close,50), "MA", colorRed);

If we add moving average in our chart then our complete code will be

/*
-------------------------------
I'Ve written this Code for the
purpose of my blog writing.

Date : December 18, 2011
-------------------------------
*/

_SECTION_BEGIN("Price");
//The below code will display the price through candlesticks
Plot( Close, "Close", ParamColor("Color", colorGold), ParamStyle("Style", styleCandle, maskAll));
_SECTION_END();


_SECTION_BEGIN("Moving Average");
//Below code will display 50 days simple moving average line
Plot (MA(Close,50), "MA", colorRed);
_SECTION_END();

//-----------------------------


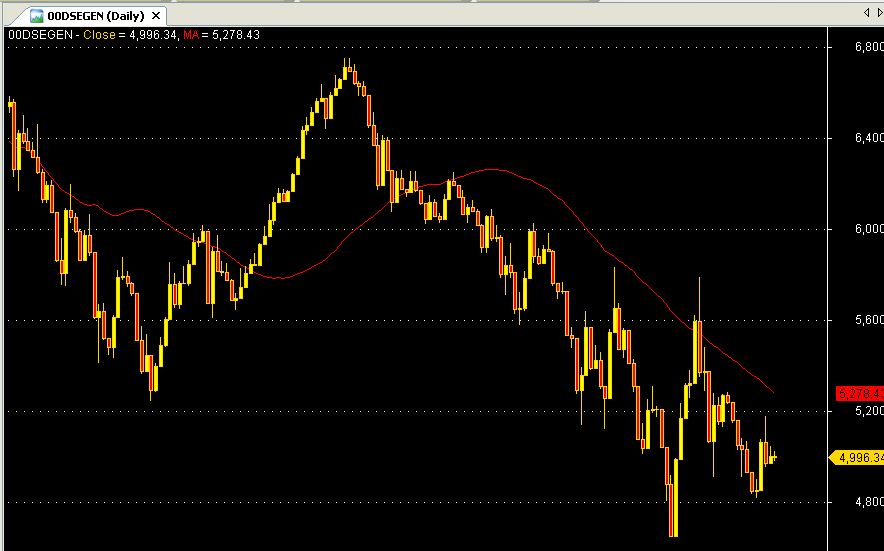
Pls. copy the above complete code and paste it in your Formula Editor and display the chart. I hope your chart looks like (if you select DSE General Index) :

Isn't easy??? Yeah, very simple. If you read my previous lessons, I know you can able to explain every word of the code.  Okay, now I'll explain the new code that I've added in this lesson.

Syntax : Plot (MA(Close,50), "MA", colorRed);
Meaning : Hello, I'm Plot() function. My job is display something in the chart. But I need some information from you. Please give me some specific information so that I can able to display as per your desire.

Syntax : Plot (MA(Close,50), "MA", colorRed);
Meaning : Ques : Okay, My first question is What will be displayed? Ans : MA() i.e. moving average will be displayed.

Syntax : Plot (MA(Close,50), "MA", colorRed);
Meaning : Ques : Understood. Moving Average will be displayed by me. But where is my data? Ans : Close price of a share is your data. I'm not telling you to do average of Open price, Low price or High price. I'm telling you only Close price.

Syntax : Plot (MA(Close,50), "MA", colorRed);
Meaning : Ques : How many days of data will I take to do average? Ans : 50 days only.

Syntax : Plot (MA(Close,50), "MA", colorRed);
Meaning : Ques : Okay, give a name of the product. You may give a name like "Jodu", "Modu", "Kodu". Ans : No no no. Its name is "MA".

Syntax : Plot (MA(Close,50), "MA", colorRed);
Meaning : Ques : What will be the color of the product? Ans : My choice is Red.

Isn't easy? Really, programming is very easy if you understand it.

Friday, December 16, 2011

AFL Code Writing : Lesson 2 (Part 5)

If you read the previous lessons, you know how to plot/display price through candlestick/bar and you are also able to explain the every word of the below code :

_SECTION_BEGIN("Price");
Plot( Close, "Close", ParamColor("Color", colorGold), ParamStyle("Style", styleCandle, maskAll));
_SECTION_END();


Today, we will learn how to write comments in the code. It's simple. We can write comments by two ways :

(1) Single line comments that starts with //
//It's single line comments

(2) Multi line comments that starts with /* and end with */
/*It's a
multi line
comments*/


Why we use comments? Is it necessary? It's depend on you. You can complete a full afl code without comments. It has no programming value. Usually, I use comments to
=> describe the code so that after 5 years I can understand why I used this code.
=> block code.

Let's see a practical example :

/*
-------------------------------
I've written this Code for the
purpose of my blog writing.
Date : December 16, 2011
-------------------------------
*/

_SECTION_BEGIN("Price");
//The below line code is not active
//Plot( Close, "Close", ParamColor("Color", colorGold), styleBar);

//The below code will display the price through candlesticks
Plot( Close, "Close", ParamColor("Color", colorGold), ParamStyle("Style", styleCandle, maskAll));
_SECTION_END();


Allah Hafiz.

Wednesday, December 14, 2011

AFL Code Writing : Lesson 2 (Part 4)

In our last lesson, I explained the below code :

_SECTION_BEGIN("Price");
Plot( Close, "Close", ParamColor("Color", colorGold), styleBar);
_SECTION_END();


And we also gave the power to our user to change the color without changing the afl code. Our chart also looked like below :

Now, we will modify the above chart. We will thick the bar by adding styleThick after styleBar.

Again Copy and paste the below code in your Formula Editor :

_SECTION_BEGIN("Price");
Plot( Close, "Close", ParamColor("Color", colorGold), styleBar | styleThick);
_SECTION_END();


Please see we did not use coma " , " to separate the two items. We've used  " | " sign. Because both are in same group. Did not understand, right? Okay, no problem. Please keep it in your mind that Bar and Thick began with style. That's why we separate styleBar | styleThick by  " | " sign instead of  " , " . I hope you have already copied and pasted the above code in your Formula Editor and your chart's bar looks like thick bar :

Again Copy and paste the below code in your Formula Editor :

_SECTION_BEGIN("Price");
Plot( Close, "Close", ParamColor("Color", colorGold), styleBar | styleThick | styleNoLabel);
_SECTION_END();


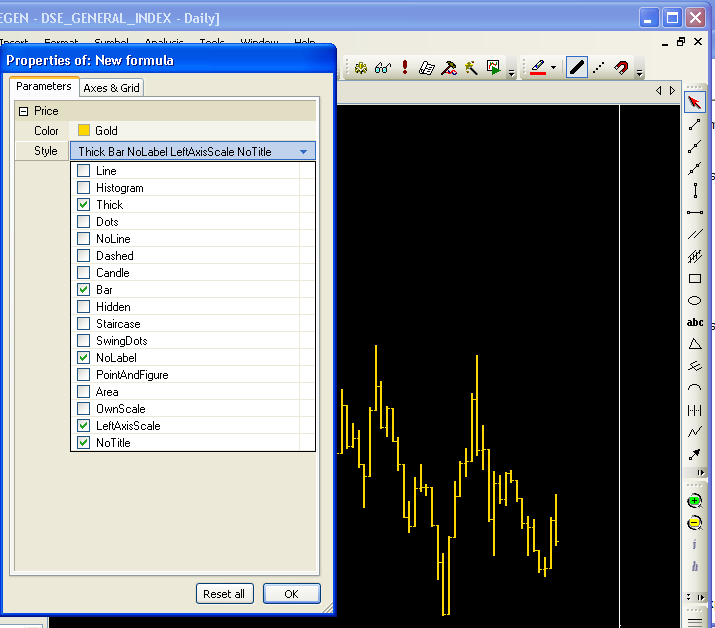
We have use styleNoLabel. As a result Label will not be displayed. Are you still confused regarding the Label? Okay, see the below chart :

I've described styleBar | styleThick | styleNoLabel  but these are not the all. Moreover, your user of afl does not know the code. We can solve this problem by the ParamStyle() function. Okay, copy and paste the below code in your formula editor:

_SECTION_BEGIN("Price");
Plot( Close, "Close", ParamColor("Color", colorGold), ParamStyle("Style", styleBar, maskAll));
_SECTION_END();


After Save As and displaying the chart, pls. right click on the chart and you will find Parameters... and click on Parameters..... your will find  :

Now checked and unchecked the box as per your desire and see the effect on the chart.

Finally, I'll describe the ParamStyle function :

Syntax : ParamStyle("Style", styleBar, maskAll)
Meaning : ParamStyle() indicates that it will be displayed in the Parameters dialog box so that our user can change the style without editing the code.


Syntax : ParamStyle("Style", styleBar, maskAll)
Meaning : "Style" - It's a name. It has no programing value. You may keep it blank. For more please see the immediate previous lesson.


Syntax : ParamStyle("Style", styleBar, maskAll)
Meaning : "styleBar" - I've taken the styleBar as default style i.e. I would like to price through bar.


Syntax : ParamStyle("Style", styleBar, maskAll)
Meaning : "maskAll" - You need not to memorize all the style. If you write maskAll, all the style will be displayed and your user will be able to select style as per their desire.

Allah Hafiz

Sunday, December 11, 2011

AFL Code Writing : Lesson 2 (Part 3)

In our last lesson, I explained the below code :

_SECTION_BEGIN("Price");
Plot( Close, "Close", colorGold, styleCandle);
_SECTION_END();


And I also gave you some task like : change the color of candle and the style of candle. I hope, you have able to change the candle and your code look like below :

_SECTION_BEGIN("Price");
Plot( Close, "Close", colorGold, styleBar);
_SECTION_END();


If you failed to do so no problem, copy the above code and paste it in your Formula Editor, Save As it in your  ........\AmiBroker\Formulas\Custom folder. If you face any problem, pls see the AFL Code Writing : Lesson 1. I hope your chart looks like the below one if you select DSE General Index as Symbol (Pls. skip the background color):


Now if you want to change the color of bar/candlesticks like red, you know how to do it. You have to write colorRed instead of colorGold and then you have to save it. Or you commercially sell your afl code and later on your user of the afl wants to change the bar/candlesticks color, but they don't know how to write afl code. If you advice them to visit this blog to know how to change the bar color, you may not get a call from your user next time to develop another system for them.

Okay, how can we change the color without editing the code? It's easy. Just Click right button of your mouse on the chart.

You will see Parameters.... Left button click on it and you will find
Nope.... It's blank. Okay, no problem. We have to make a little change in our afl code. Okay, leave the page by clicking Ok and again right click on the chart and you will find Parameters...., Properties and then Edit Formula... Left click on Edit Formula and you will find your code.

Just write ParamColor("Color", colorGold) instead of colorGold. So, your final code will be :

_SECTION_BEGIN("Price");
Plot( Close, "Close", ParamColor("Color", colorGold), styleBar);
_SECTION_END();


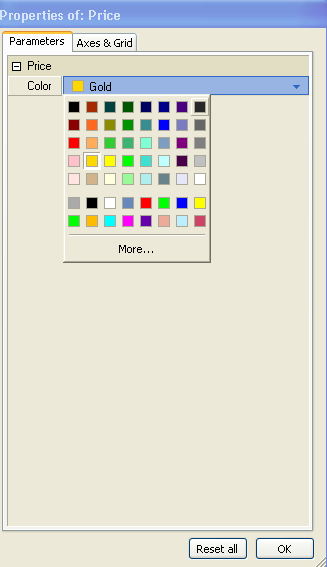
Now, Save As it. (Pls. see the  AFL Code Writing : Lesson 1 if you don't know how to Save As a file and display the chart). Right Click on the chart and you will get Parameters... Click on it and you will find

Wow!!! Lots of color. Select any color and click ok. Bar color will be changed as per your change. Now your user able to change the color of bar as per their desire without knowing any code. Our job is done.

No No No No No No No. I don't want to give any Faki-zuki. Now see the explanation our newly added code :

Syntax : ParamColor("Color", colorGold)
Meaning : ParamColor() indicates that it will be displayed in the Parameters dialog box so that our user can change the color without editing the code.
ParamColor("Color",) indicates that the name of the besides item. You may keep it blank like "". Then program automatically pick the afl name.
ParamColor("", colorGold) indicates that we have given a default color i.e. Gold color.

Friday, December 9, 2011

AFL Code Writing : Lesson 2 (Part 2)

Today I will describe the line no. 2 of the below code :
Before explain the the above code, I would like to take more easy code. I already described the Line 1 and Line 3 in our previous lesson. So, I have omitted the Line 1 and Line 3. I'll describe the Line 2 by a non Programming way so that you can understand the code easily. I've no intension to make you mad at the beginning by describing the FUNCTION / PARAMETERS / ARGUMENTS / ARRAY. Okay, pls. look at the below code :

Syntax : Plot( Close, "Close", colorGold, styleCandle);
We have used Plot ( .......) to display the chart.


Syntax : Plot(Close, "Close", colorGold, styleCandle);
We have used Close, "Close", . 1st Close has been used to take the price and 2nd "Close" is the name of the 1st  Close. You may keep it blank or empty like  "  " or give a new name like  "It will take price"

Syntax : Plot(Close, "Close", colorGold, styleCandle);
We have used colorGold to color the price that has been displayed by Candle Sticks. Pls. see the below:

Syntax : Plot(Close, "Close", colorGold, styleCandle);
We have used styleCandle to display our price through Candle Sticks.

If you don't understand the line 2 yet, no problem pls see the below revision:

Syntax : Plot(Close, "Close", colorGold, styleCandle;
Plot will display the chart.
What chart will be displayed? Price Chart. Close will gives the data of the price that will be displayed through styleCandle. 
What will be the color of the price chart? colorGold will give a gold color.

If you don't understand yet, no problem just copy the below code and paste it in your Formula Editor :

_SECTION_BEGIN("Price");
Plot( Close, "Close", colorGold, styleCandle);
_SECTION_END();


Now, your job is
=> write styleBar instead of styleCandle and see the effect.
=> write colorAqua instead of colorGold and see the effect.
=> write Open, "Open" instead of  Close, "Close" and see the effect.

Wednesday, December 7, 2011

AFL Code Writing : Lesson 2 (Part 1)

Today, we will explain our own written first afl code.

In our AFL Code Writing : Lesson 1, we wrote our first below code :


It's only 3 lines code. First I will describe the line no. 1 and 3 then finally line no. 2. Pls. see the line 1 and 3 below :

Line 1 (begin) described that we have started writing our code and Line 3 (end) described that we have finished our code writing. Between this Begin and End, we will write our code that can be several lines. Pls. see below for example :


Not only you can write multiple line code but also use multiple section i.e. Begin and End in your afl. We usually do it to organize our code. Pls. see the below example :

You have already noticed that we had given different name of each Begin and End. We did it for our own benefit.  It has no any programing value. We can keep it blank/empty or you can give a different name. If you did not understand which point I'm talking about, pls see the below example :

Finally, keep the below points in your mind :

Syntax : _SECTION_BEGIN(" ");
Meaning: We open a section to start our code

Syntax : _SECTION_END();
Meaning : Our section has end i.e. we have finished code writing for this section.

Every complete line you have to finish by a semicolon.

In our AFL Code Writing : Lesson 2 (Part 2), I will discuss the line no. 2 i.e.

Plot( Close, "Close", ParamColor("Color", colorGold ), styleCandle);

Tuesday, December 6, 2011

AFL Code Writing : Lesson 1

I assume that you have no any knowledge in programing language even AmiBroker code. Okay, let's start.

Today, we will  :
(1) Open AmiBroker Formula Editor.
(2) Write our first afl code.
(3) Check for error.
(4) Save our afl code.
(5) Display our chart in AmiBroker.
In our next lesson we will explain our first afl code.

(1) How to open AmiBroker Formula Editor ?
Pls. follow the below steps :
=> Open your AmiBroker.
=> Click "Analysis" from Manu bar.

=> Click "Formula Editor..." or Click directly "Formula Editor" icon directly from Toolbar.

Now you have done your first step. You have able to open AmiBroker Formula Editor.

(2) Now, you will write your first code. We will explain each line of the code in our next lesson. Okay write down the below code in your AmiBroker Formula Editor :

Or Copy the below code and paste your Formula Editor :

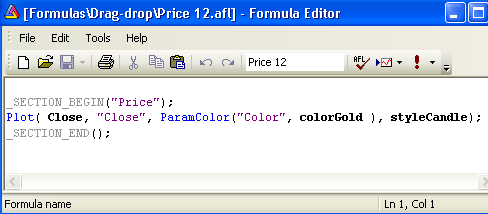
_SECTION_BEGIN("Price");
Plot( Close, "Close", ParamColor("Color", colorGold ), styleCandle);
_SECTION_END();


Wow!!! you have written your first afl code.

(3) If you make any mistake in your afl code even miss a semicolon ";", you will not able to see the chart. How you will check your code? It's easy. Just Click "Tools" and then "Verify Syntax" or click the Verify Syntax icon in the Toolbar directly. Confused? Okay see the below image :
After clicking the Verify syntax, have you seen any change? No change? Really? Wow!!! you have able to write a error free code. 

Okay, if you make a mistake then what will be happened? After clicking the Verify syntax, it will show us error with with line number. The error line will be marked by yellow and in the bottom, you will find the details including the line number of the error.  Pls. see the below image :
I hope, you have already found my mistake. I've missed to put the semicolon at end of the line 3 _SECTION_END();

If   Verify syntax finds any error, you will not able to see your chart.  


(4) I hope, you know how to save a file. So, I'm not going to in details. Just keep in mind that you have to save the file in   ........\AmiBroker\Formulas\Custom   folder. Like. C:\Program Files\AmiBroker\Formulas\Custom
Okay, Click File menu of your Formula Editor then Click Save As and then save the file in the name of "Price" in the   ....\AmiBroker\Formulas\Custom   folder. Pls. see the below Image :

After saving the file, pls. close your Formula Editor by clicking File and then Exit.


(5) Now, we will see our created chart. Pls. see the below image :

1. Click "Chart" and 2. expand the Custom folder by clicking the "+" sign and then you will see your saved first afl code name Price, finally 3. double click on your Price afl and then you will see your own created chart. Wow!!!!. Congratulation!!!!!

After expanding the custom folder, if you don't able to see your Price afl you may assure that you could not save the file in the right place. Pls. save your Price afl in   ........\AmiBroker\Formulas\Custom   folder. First find where have you installed your AmiBroker. In AmiBroker you will find the Formulas Folder. In Formulas folder you will find the Custom Folder. Always save your afl here.

In our next lesson, I will explain the code. Later on we will create our own afl even trading system. Allah Hafiz.

Monday, December 5, 2011

Please keep in mind.....

"Your money, Your decision". No need to follow others advise specially in share market.
-------------------------------------------------------------------------------------------------------------------------
Please note that this analysis/charts/comments does NOT mean that (1) I'm holding this share, (2) I've an intention to buy/sell it, (3) I'm suggesting you to buy/sell/hold it. All these are for our learning purpose. by JC

Sunday, December 4, 2011