Thursday, December 22, 2011

AFL Code Writing : Lesson 3 (Part 3)

Today we will make our simple moving average more dynamic. By the below code, our user is able to change the color and style of the moving average line without changing the code each time :

//Below code will display 100 days simple moving average line
Plot (MA(Close,100), "MA", ParamColor("Color", colorRed), ParamStyle("Style", styleThick));


But your user is not able to change the period dynamically. Like s/he would like to see the 50 days simple moving average. S/he needs to change the code. BTW, we can solve the problem by Param() function. Pls. see the below modified line of our simple moving average :

//Your user will be able to change the periods without changing the code
Plot (MA(Close, Param("Periods", 50)), "MA", ParamColor("Color", colorRed), ParamStyle("Style", styleThick));


By right button clicking or pressing Ctrl+R on the chart, your user is able to change the periods of moving average as per their desire. Pls. see the below image :


By dragging the bar, your user will be able to change the periods without changing the code. If you still confused please see the below explanation image :


Syntax :  Param("Periods", 50)
Meaning : By writing Param(), we are telling that it will be added in Parameters... so that our user can change the value without changing the code each time . "Periods" is name and 50 is default value.

Please keep in mind that by default Minimum value is 0 and Maximum value is 100. That is your user will be able to see the 0 to 100 days simple moving average. If s/he wish to see the 200 days moving average, s/he will not able to see it. Okay, we will give him/her a power to see upto 300 days simple moving average by the below code :

//Your user will be able to see 2 to 300 days simple moving average
Plot (MA(Close, Param("Periods", 50, 2, 300)), "MA", ParamColor("Color", colorRed), ParamStyle("Style", styleThick));


Syntax :  Param("Periods", 50, 2, 300)
Meaning : Here 2 is the minimum value and 300 is the maximum value.

Below is the our upto date complete code :

/*
-------------------------------
I've written this Code for the
purpose of my blog writing.

 Date : December 21, 2011
-------------------------------
*/

_SECTION_BEGIN("Price");
//The below code will display the price through candlesticks
Plot( Close, "Close", ParamColor("Color", colorGold), ParamStyle("Style", styleCandle, maskAll));
_SECTION_END();


_SECTION_BEGIN("Moving Average");
//Below code will display 50 days simple moving average line
Plot (MA(Close, Param("Periods", 50, 2, 300)), "MA", ParamColor("Color", colorRed), ParamStyle("Style", styleThick));
_SECTION_END();

//-----------------------------


Allah Haifz.

Wednesday, December 21, 2011

AFL Code Writing : Lesson 3 (Part 2)

Today, we will give more power to our afl user. Our user will be able to change the color and style of moving average line without editing the code. But how? Let's see

By the below code, our user will not able to change the color through Parameters... (Right click on the chart and you will find the Parameters...). Because our below code is not dynamic. If our user wants to change the color of line s/he needs to change the code.

//Below code is not a dynamic code
Plot (MA(Close,50), "MA", colorRed);


But how can make our code dynamic so that our users can change the color as their desire without changing the code every time? It's easy. You have done this before. Just remember it. If you can't remember, don't worry. Just see the below code.

//Now our user will able to change the color of line dynamically
Plot (MA(Close,50), "MA", ParamColor("Color", colorRed)
);

By adding ParamColor(), we have given power to our user to change the color through Parameters without changing the code. But our above code is not fully dynamic because our user is not able to change the line style dynamically.

//Now our user will able to change the line style dynamically
Plot (MA(Close,50), "MA", ParamColor("Color", colorRed), ParamStyle("Style", styleThick));


In a previous lesson, I explained the ParamColor() and ParamStyle(). So, I'm not going to explain it again. Below is the upto date complete code :

/*
-------------------------------
I've written this Code for the
purpose of my blog writing.

Date : December 20, 2011
-------------------------------
*/

_SECTION_BEGIN("Price");
//The below code will display the price through candlesticks
Plot( Close, "Close", ParamColor("Color", colorGold), ParamStyle("Style", styleCandle, maskAll));
_SECTION_END();


_SECTION_BEGIN("Moving Average");
//Below code will display 50 days simple moving average line
Plot (MA(Close,50), "MA", ParamColor("Color", colorRed), ParamStyle("Style", styleThick));
_SECTION_END();

//-----------------------------


In our next lesson, I'll show you how can we make our moving average code more dynamic. Some of my friends are eager to see the moving average cross over. Don't worry. I'll explain it. Allah Hafiz.

Sunday, December 18, 2011

AFL Code Writing : Lesson 3 (Part 1)


We already know how to add price through bar or candlestick. Today, we will add Moving Average in our chart.

We can add Moving Average in our chart just by adding below one line code :

Plot (MA(Close,50), "MA", colorRed);

If we add moving average in our chart then our complete code will be

/*
-------------------------------
I'Ve written this Code for the
purpose of my blog writing.

Date : December 18, 2011
-------------------------------
*/

_SECTION_BEGIN("Price");
//The below code will display the price through candlesticks
Plot( Close, "Close", ParamColor("Color", colorGold), ParamStyle("Style", styleCandle, maskAll));
_SECTION_END();


_SECTION_BEGIN("Moving Average");
//Below code will display 50 days simple moving average line
Plot (MA(Close,50), "MA", colorRed);
_SECTION_END();

//-----------------------------


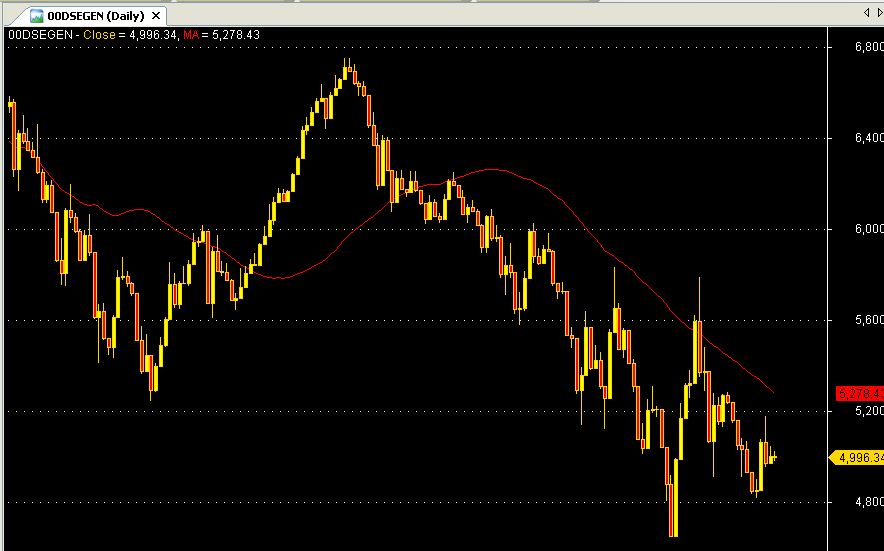
Pls. copy the above complete code and paste it in your Formula Editor and display the chart. I hope your chart looks like (if you select DSE General Index) :

Isn't easy??? Yeah, very simple. If you read my previous lessons, I know you can able to explain every word of the code.  Okay, now I'll explain the new code that I've added in this lesson.

Syntax : Plot (MA(Close,50), "MA", colorRed);
Meaning : Hello, I'm Plot() function. My job is display something in the chart. But I need some information from you. Please give me some specific information so that I can able to display as per your desire.

Syntax : Plot (MA(Close,50), "MA", colorRed);
Meaning : Ques : Okay, My first question is What will be displayed? Ans : MA() i.e. moving average will be displayed.

Syntax : Plot (MA(Close,50), "MA", colorRed);
Meaning : Ques : Understood. Moving Average will be displayed by me. But where is my data? Ans : Close price of a share is your data. I'm not telling you to do average of Open price, Low price or High price. I'm telling you only Close price.

Syntax : Plot (MA(Close,50), "MA", colorRed);
Meaning : Ques : How many days of data will I take to do average? Ans : 50 days only.

Syntax : Plot (MA(Close,50), "MA", colorRed);
Meaning : Ques : Okay, give a name of the product. You may give a name like "Jodu", "Modu", "Kodu". Ans : No no no. Its name is "MA".

Syntax : Plot (MA(Close,50), "MA", colorRed);
Meaning : Ques : What will be the color of the product? Ans : My choice is Red.

Isn't easy? Really, programming is very easy if you understand it.

Friday, December 16, 2011

AFL Code Writing : Lesson 2 (Part 5)

If you read the previous lessons, you know how to plot/display price through candlestick/bar and you are also able to explain the every word of the below code :

_SECTION_BEGIN("Price");
Plot( Close, "Close", ParamColor("Color", colorGold), ParamStyle("Style", styleCandle, maskAll));
_SECTION_END();


Today, we will learn how to write comments in the code. It's simple. We can write comments by two ways :

(1) Single line comments that starts with //
//It's single line comments

(2) Multi line comments that starts with /* and end with */
/*It's a
multi line
comments*/


Why we use comments? Is it necessary? It's depend on you. You can complete a full afl code without comments. It has no programming value. Usually, I use comments to
=> describe the code so that after 5 years I can understand why I used this code.
=> block code.

Let's see a practical example :

/*
-------------------------------
I've written this Code for the
purpose of my blog writing.
Date : December 16, 2011
-------------------------------
*/

_SECTION_BEGIN("Price");
//The below line code is not active
//Plot( Close, "Close", ParamColor("Color", colorGold), styleBar);

//The below code will display the price through candlesticks
Plot( Close, "Close", ParamColor("Color", colorGold), ParamStyle("Style", styleCandle, maskAll));
_SECTION_END();


Allah Hafiz.

Wednesday, December 14, 2011

AFL Code Writing : Lesson 2 (Part 4)

In our last lesson, I explained the below code :

_SECTION_BEGIN("Price");
Plot( Close, "Close", ParamColor("Color", colorGold), styleBar);
_SECTION_END();


And we also gave the power to our user to change the color without changing the afl code. Our chart also looked like below :

Now, we will modify the above chart. We will thick the bar by adding styleThick after styleBar.

Again Copy and paste the below code in your Formula Editor :

_SECTION_BEGIN("Price");
Plot( Close, "Close", ParamColor("Color", colorGold), styleBar | styleThick);
_SECTION_END();


Please see we did not use coma " , " to separate the two items. We've used  " | " sign. Because both are in same group. Did not understand, right? Okay, no problem. Please keep it in your mind that Bar and Thick began with style. That's why we separate styleBar | styleThick by  " | " sign instead of  " , " . I hope you have already copied and pasted the above code in your Formula Editor and your chart's bar looks like thick bar :

Again Copy and paste the below code in your Formula Editor :

_SECTION_BEGIN("Price");
Plot( Close, "Close", ParamColor("Color", colorGold), styleBar | styleThick | styleNoLabel);
_SECTION_END();


We have use styleNoLabel. As a result Label will not be displayed. Are you still confused regarding the Label? Okay, see the below chart :

I've described styleBar | styleThick | styleNoLabel  but these are not the all. Moreover, your user of afl does not know the code. We can solve this problem by the ParamStyle() function. Okay, copy and paste the below code in your formula editor:

_SECTION_BEGIN("Price");
Plot( Close, "Close", ParamColor("Color", colorGold), ParamStyle("Style", styleBar, maskAll));
_SECTION_END();


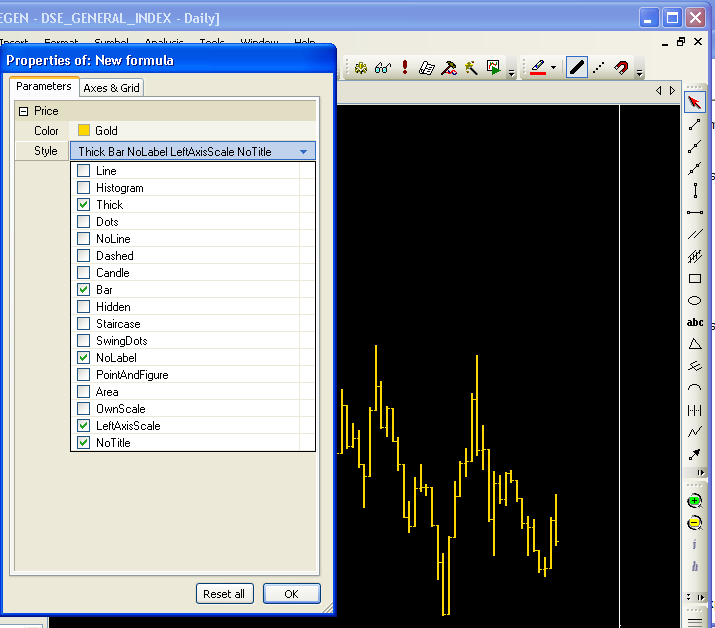
After Save As and displaying the chart, pls. right click on the chart and you will find Parameters... and click on Parameters..... your will find  :

Now checked and unchecked the box as per your desire and see the effect on the chart.

Finally, I'll describe the ParamStyle function :

Syntax : ParamStyle("Style", styleBar, maskAll)
Meaning : ParamStyle() indicates that it will be displayed in the Parameters dialog box so that our user can change the style without editing the code.


Syntax : ParamStyle("Style", styleBar, maskAll)
Meaning : "Style" - It's a name. It has no programing value. You may keep it blank. For more please see the immediate previous lesson.


Syntax : ParamStyle("Style", styleBar, maskAll)
Meaning : "styleBar" - I've taken the styleBar as default style i.e. I would like to price through bar.


Syntax : ParamStyle("Style", styleBar, maskAll)
Meaning : "maskAll" - You need not to memorize all the style. If you write maskAll, all the style will be displayed and your user will be able to select style as per their desire.

Allah Hafiz

Sunday, December 11, 2011

AFL Code Writing : Lesson 2 (Part 3)

In our last lesson, I explained the below code :

_SECTION_BEGIN("Price");
Plot( Close, "Close", colorGold, styleCandle);
_SECTION_END();


And I also gave you some task like : change the color of candle and the style of candle. I hope, you have able to change the candle and your code look like below :

_SECTION_BEGIN("Price");
Plot( Close, "Close", colorGold, styleBar);
_SECTION_END();


If you failed to do so no problem, copy the above code and paste it in your Formula Editor, Save As it in your  ........\AmiBroker\Formulas\Custom folder. If you face any problem, pls see the AFL Code Writing : Lesson 1. I hope your chart looks like the below one if you select DSE General Index as Symbol (Pls. skip the background color):


Now if you want to change the color of bar/candlesticks like red, you know how to do it. You have to write colorRed instead of colorGold and then you have to save it. Or you commercially sell your afl code and later on your user of the afl wants to change the bar/candlesticks color, but they don't know how to write afl code. If you advice them to visit this blog to know how to change the bar color, you may not get a call from your user next time to develop another system for them.

Okay, how can we change the color without editing the code? It's easy. Just Click right button of your mouse on the chart.

You will see Parameters.... Left button click on it and you will find
Nope.... It's blank. Okay, no problem. We have to make a little change in our afl code. Okay, leave the page by clicking Ok and again right click on the chart and you will find Parameters...., Properties and then Edit Formula... Left click on Edit Formula and you will find your code.

Just write ParamColor("Color", colorGold) instead of colorGold. So, your final code will be :

_SECTION_BEGIN("Price");
Plot( Close, "Close", ParamColor("Color", colorGold), styleBar);
_SECTION_END();


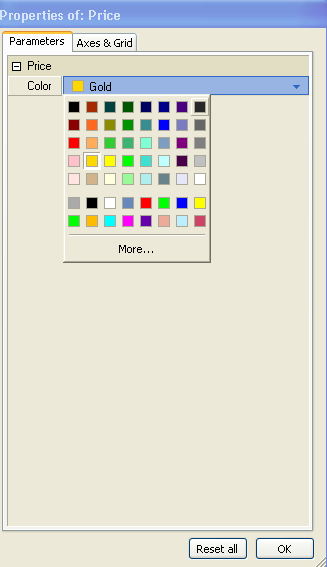
Now, Save As it. (Pls. see the  AFL Code Writing : Lesson 1 if you don't know how to Save As a file and display the chart). Right Click on the chart and you will get Parameters... Click on it and you will find

Wow!!! Lots of color. Select any color and click ok. Bar color will be changed as per your change. Now your user able to change the color of bar as per their desire without knowing any code. Our job is done.

No No No No No No No. I don't want to give any Faki-zuki. Now see the explanation our newly added code :

Syntax : ParamColor("Color", colorGold)
Meaning : ParamColor() indicates that it will be displayed in the Parameters dialog box so that our user can change the color without editing the code.
ParamColor("Color",) indicates that the name of the besides item. You may keep it blank like "". Then program automatically pick the afl name.
ParamColor("", colorGold) indicates that we have given a default color i.e. Gold color.

Friday, December 9, 2011

AFL Code Writing : Lesson 2 (Part 2)

Today I will describe the line no. 2 of the below code :
Before explain the the above code, I would like to take more easy code. I already described the Line 1 and Line 3 in our previous lesson. So, I have omitted the Line 1 and Line 3. I'll describe the Line 2 by a non Programming way so that you can understand the code easily. I've no intension to make you mad at the beginning by describing the FUNCTION / PARAMETERS / ARGUMENTS / ARRAY. Okay, pls. look at the below code :

Syntax : Plot( Close, "Close", colorGold, styleCandle);
We have used Plot ( .......) to display the chart.


Syntax : Plot(Close, "Close", colorGold, styleCandle);
We have used Close, "Close", . 1st Close has been used to take the price and 2nd "Close" is the name of the 1st  Close. You may keep it blank or empty like  "  " or give a new name like  "It will take price"

Syntax : Plot(Close, "Close", colorGold, styleCandle);
We have used colorGold to color the price that has been displayed by Candle Sticks. Pls. see the below:

Syntax : Plot(Close, "Close", colorGold, styleCandle);
We have used styleCandle to display our price through Candle Sticks.

If you don't understand the line 2 yet, no problem pls see the below revision:

Syntax : Plot(Close, "Close", colorGold, styleCandle;
Plot will display the chart.
What chart will be displayed? Price Chart. Close will gives the data of the price that will be displayed through styleCandle. 
What will be the color of the price chart? colorGold will give a gold color.

If you don't understand yet, no problem just copy the below code and paste it in your Formula Editor :

_SECTION_BEGIN("Price");
Plot( Close, "Close", colorGold, styleCandle);
_SECTION_END();


Now, your job is
=> write styleBar instead of styleCandle and see the effect.
=> write colorAqua instead of colorGold and see the effect.
=> write Open, "Open" instead of  Close, "Close" and see the effect.