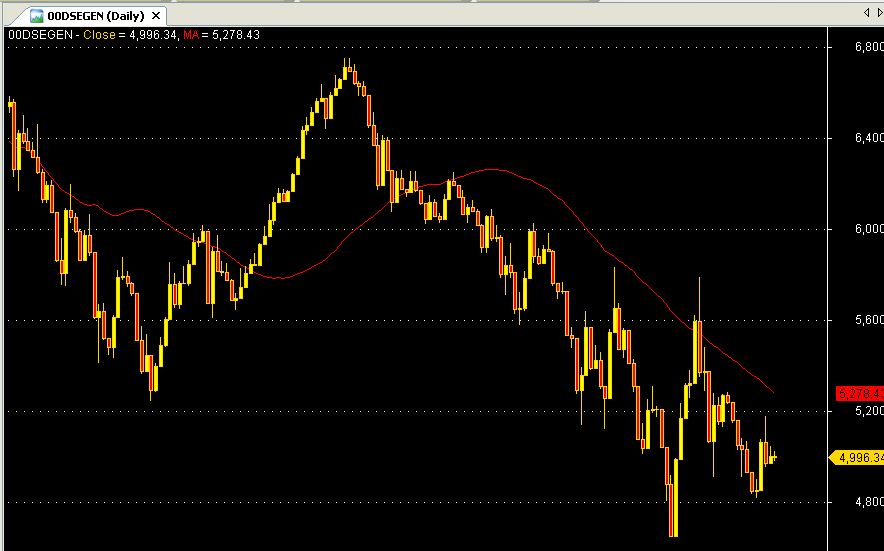
//Below code will display 100 days simple moving average line
Plot (MA(Close,100), "MA", ParamColor("Color", colorRed), ParamStyle("Style", styleThick));
But your user is not able to change the period dynamically. Like s/he would like to see the 50 days simple moving average. S/he needs to change the code. BTW, we can solve the problem by Param() function. Pls. see the below modified line of our simple moving average :
//Your user will be able to change the periods without changing the code

Plot (MA(Close, Param("Periods", 50)), "MA", ParamColor("Color", colorRed), ParamStyle("Style", styleThick));
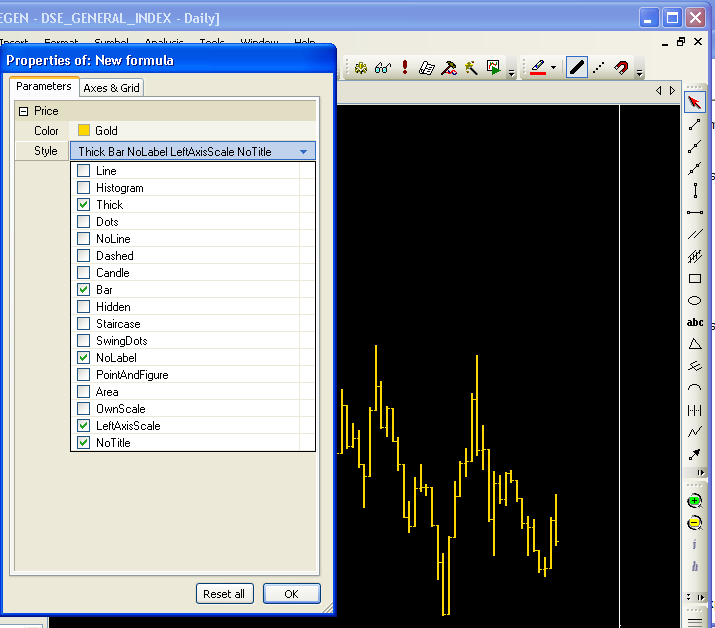
By right button clicking or pressing Ctrl+R on the chart, your user is able to change the periods of moving average as per their desire. Pls. see the below image :

By dragging the bar, your user will be able to change the periods without changing the code. If you still confused please see the below explanation image :

Syntax :
Param("Periods", 50)
Meaning : By writing Param(), we are telling that it will be added in Parameters... so that our user can change the value without changing the code each time . "Periods" is name and 50 is default value.
Please keep in mind that by default Minimum value is 0 and Maximum value is 100. That is your user will be able to see the 0 to 100 days simple moving average. If s/he wish to see the 200 days moving average, s/he will not able to see it. Okay, we will give him/her a power to see upto 300 days simple moving average by the below code :
//Your user will be able to see 2 to 300 days simple moving average

Plot (MA(Close, Param("Periods", 50, 2, 300)), "MA", ParamColor("Color", colorRed), ParamStyle("Style", styleThick));
Syntax :
Param("Periods", 50, 2, 300)
Meaning : Here 2 is the minimum value and 300 is the maximum value.
Below is the our upto date complete code :
/*
-------------------------------
I've written this Code for the
purpose of my blog writing.
Date : December 21, 2011
-------------------------------
*/
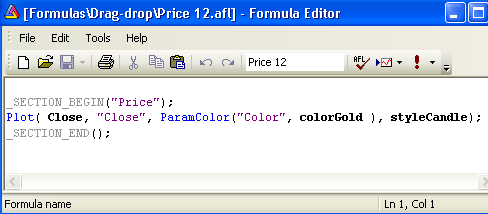
_SECTION_BEGIN("Price");
//The below code will display the price through candlesticks
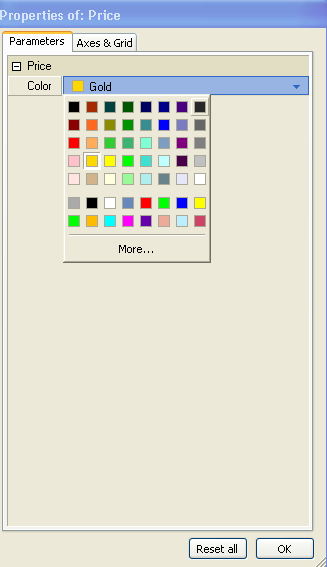
Plot( Close, "Close", ParamColor("Color", colorGold), ParamStyle("Style", styleCandle, maskAll));
_SECTION_END();
_SECTION_BEGIN("Moving Average");
//Below code will display 50 days simple moving average line
Plot (MA(Close, Param("Periods", 50, 2, 300)), "MA", ParamColor("Color", colorRed), ParamStyle("Style", styleThick));
_SECTION_END();
//-----------------------------
Allah Haifz.