Monday, November 28, 2011

Chart Reading : Lesson - 4 (Part : 1)

Today, I will discuss regarding the Breakout. Before discussion, pls. see the Chart - 1 first :
After breaking the resistance, price went to up

When price breaks a Support or Resistance level, we usually call it Breakout. Breakout occurs with high volume and big movement.of price.

Some investors follow Breakout Trading Strategy/Technique i.e. they buy shares when price break the resistance level and sell share when price break the support level. Please check some previous chart and I hope you will find that several successful trend started after a breakout. A portion of my capital, I invest according to the Breakout Trading Strategy/Technique.

No trading system/technique is 100% accurate. So, you may sometimes caught by breakout, usually we call it - "Fakeout". Please see the below Chart -2 :
After breaking the resistance, price went to down

To overcome this problem, pls wait for the next lesson. Best of Luck!!!

Sunday, November 27, 2011

Case Study : DSEGEN INDEX

Can we expect a pullback here? Time will say. Pls. see the chart :

(Pls. click on the image to enlarge)

Saturday, November 26, 2011

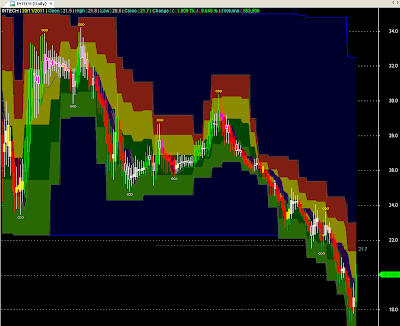
Case Study : INTECH

Directors are getting punishment............

(Pls. click on the image to enlarge)

Case Study : RUPALIINS

Price is above the signal line that is also acting as a support line. Let's see what happen.....

(Pls. click on the image to enlarge)

Case Study : APEXFOODS

Still above the support line and closely watching this.... If it able to sustain, it may go up further......

(Pls. click on the image to enlarge)

Case Study : CITYBANK

Successfully able to break its resistance line that is now acting as a support line. Volume also looks good. Hope support line will able to sustain.

(Pls. click on the image to enlarge)

Case Study : GREENDELMF

Its last day volume has disappointed me. Except this one everything is looking good. Signal line is its support line.
(Pls. click on the image to enlarge)

Case Study : NPOLYMAR

Staying below the signal line which is also acting as a resistance line. Let's see what happen in the coming week....
(Pls. click on the image to enlarge)

Case Study : EHL

It has just hit the resistance line. It needs to break the resistance line with volume. But we also keep our mind - our last time experience. It did not able to sustain long time above the signal line.

(Pls. click on the image to enlarge)

Case Study : PRIMETEX

Fighting it with its support zone. If fresh money comes, it will able to survive, otherwise.........

(Pls. click on the image to enlarge)

Case Study : MICEMENT

MICEMENT is still trying to find its bottom.

(Pls. click on the image to enlarge)

Case Study : SIBL

Please see the below chart :


Price is above the dynamic support line and SIBL has formed a Higher Low. But its resistance line is also strong. Until breaking out the ascending triangle, we have to wait for next trend usually uptrend. Let's see what happen in next.....

Friday, November 25, 2011

Case Study : TALLUSPIN

Present Price of TALLUSPIN  is staying in a correction stage though it has broken the down trend line. If it able to attract more fresh money, it will go up otherwise will go down or will stay in sideways zone. Pls. see the below chart :

(Pls. click on the image to enlarge)

Case Study : NAVANACNG

After a long down trend, price has able to cross the dynamic resistance line that is now acting as a dynamic support line. Now, need some fresh money to hold the present price. Pls. look at the below chart :

(Pls. click on the image to enlarge)

Thursday, November 24, 2011

Case Study : DSEGEN INDEX

Some investors are afraid after seeing the today's sudden fall of 224 point. But I don't understand why they are afraid. A smart investor will alert when price/point hits their support zone and he will get out from the market when the price/point breaks the support. If individual share price hits the stop-loss, that is a different case.

Okay, pls. see the below chart. We will try to find a possible support comparing with our immediate previous experience.


As indicated in the chart, we first see that point has broken the (1) resistance line and then got a (2) support. After a successful uptrend, point has broken the (3) support line. Later on it has acted as our resistance line and two times point has touched that line (4 and 5).

Now, pls. enlarge the picture by clicking on the chart and find where is the support line and where is the index point. Best of luck. by JC

Tuesday, November 22, 2011

Case Study : DSEGEN INDEX

Today, No graph. No analysis. Kono analysis er dorkar nei. Most of the script is playing. So, let your profit to run until hits your Stop-Loss.

Monday, November 21, 2011

Case Study : APEXFOODS

Something is cooking inside.......... Be watchful......

(Pls. click on the image to enlarge)

Case Study : INTECH

Please see the below chart :.

(Pls. click on the image to enlarge)

We have already witnessed of two consecutive gaps. We don't want to see more gap that will bring it to overbought stage. Price is staying above the BB mid line. Volume is increasing. Last Candlestick is also giving me a hope. Let's see what happen in the coming days. We will follow it up. Now, see the below chart (coder of this afl is my GURU):

(Pls. click on the image to enlarge)

Sunday, November 20, 2011

Case Study : TALLUSPIN

Huge game is going on. Please see the below chart :

(Pls. click on the image to enlarge)

Please see the previous up, marked buy white color. Price increased with several days large volume. Now, look at the present up and also look at the volume, marked by yellow. I hope, now you are clear. Need more volume to hold this present price.

If I have this share I'll let my profit to run. But I'll also tighten my stop-loss.

If I plan for new buy, I'll consider the above chart. If volume does not increase, I'll get a correction stage and also that time other condition allow me, I'll consider it.

Saturday, November 19, 2011

Chart of all Mutual Fund (November 17, 2011)

(Pls. click on the image to enlarge)

Sector Chart of Tannery (November 17, 2011)

(Pls. click on the image to enlarge)

Sector Chart of Life Insurance (November 17, 2011)

(Pls. click on the image to enlarge)

Sector Chart of General Insurance (November 17, 2011)

(Pls. click on the image to enlarge)

Sector Chart of Ceramics (November 17, 2011)

(Pls. click on the image to enlarge)

Sector Chart of Cement (November 17, 2011)

(Pls. click on the image to enlarge)

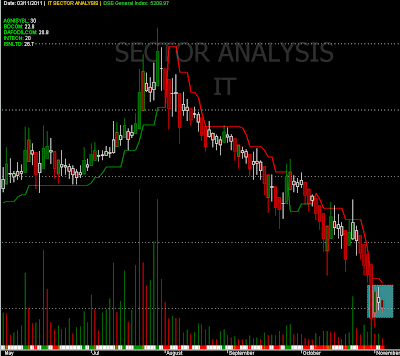
Sector Chart of IT (November 17, 2011)

(Pls. click on the image to enlarge)

How to import CSV data in AmiBroker

Please see the below images and follow the steps one by one. You may click on the image to enlarge the image.


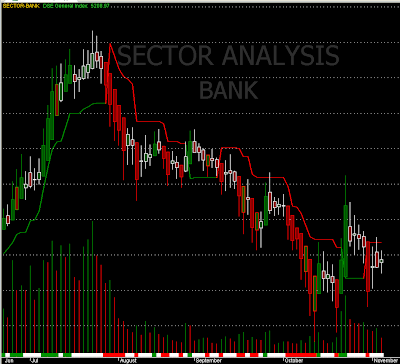
Sector Chart of Bank (November 17, 2011)

(Pls. click on the image to enlarge)

Thursday, November 17, 2011

Chart Reading : Lesson - 3 (Part : 4)

Throughout our Lesson - 3, we are discussing identifying Market Trend (Up Trend/Bullish, Down Trend/Bearish and Sideways) manually. This post is the closing of the Lesson - 3.

Usually, we like the Up Trend or Bullish market because it gives us profit.We dislike the Down Trend or Bearish Market because it gives us loss. And we feel safe in sideways market because at least, share price is not going to down.

Why we dislike the down trend market? Because, in down trend market, our view is short term, we hold shares and hope that market will rebound soon and gives us a big profit. So, we can't able to cut the loss early and finally, we carry the small loss to huge loss.

If we can able to cut the loss early, we will also enjoy the down trend as like as up trend. We will only dislike the Sideways market because it will give us nothing. I'm finishing this post by a famous quote :

"Winners hold their winning trades, losers hold their losing trades."

Tuesday, November 15, 2011

Chart Reading : Lesson - 3 (Part : 3)

In our previous two lessons, we saw how to detect the Up Trend/Bullish market and Down Trend/Bearish market manually. Today, we will see how to detect the Sideways Market. It's easy.

When you will not able to detect the Up Trend market or Down Trend market, you may sure that you are staying in a Sideways market. Please see the below chart :

(Pls. click on the image to enlarge)

In Sideways market, you will not able to detect several confirmed HH-HL or LL-LH. We always avoid this market. Because we will not play for nothing. For details pls. wait for Chart Reading : Lesson - 3 (Part : 4). by JC

Saturday, November 12, 2011

Case Study : DSEGEN INDEX

DSE General Index now at 5209. We are standing on a Psychological Support at 5000 and a Fibonacci Retracement Support around 4920. Please see the below chart :

                                (Pls. click on the image to enlarge)

What should we do now :

=> If you bought share between General Index 5000 and 5300 : Please tighten your stop-loss. If you find reversal you may increase your position.

=> If your loss grater than 30% : I've some advice for you. Now, you have nothing to lose. You may think - you have invested for long term like FDR.

=> If you have cash, you may wait for the reversal. If you can't patience, you may take a taste of the market by a little portion of your money (15%-20%). Pls. don't forget the Stop-loss.

Finally, hopping and prying for a stable market. by JC

Sector Chart of General Insurance (November 3, 2011)

(Pls. click on the image to enlarge)

Friday, November 11, 2011

Chart Reading : Lesson - 3 (Part : 2)

In our Chart Reading : Lesson - 3 (Part : 1), we discussed regarding the identifying Up Trend/Bullish. Today, we will discussed regarding the identifying Down Trend/Bearish. Please see the below Chart :

(Pls. click on the image to enlarge)

After a bullish or Up Trend, if you find that price is forming Lower Low (LL) and Lower High (LH) one after another, you can say it Down Trend/Bearish.

When price form a Lower Low (LL), please don't be Panicked for Sell. Market always gives you a chance for Sell by forming Lower High (LH). Yes, the Lower High (LH) is your EXIT/Sell point.

Precondition of Lower Low (LL) and Lower High (LH) : The LL or LH must be below the previous LL or LH respectively. Please check it with the above chart. by JC

Thursday, November 10, 2011

Chart Reading : Lesson - 3 (Part : 1)

One of my previous post, I discussed regarding the Market Trend and I showed you how to detect the market trend by Bollinger Band. The Link is http://dse-analysis.blogspot.com/2011/10/market-trend.html. Throughout our Lesson - 3, we will detect the Market Trend manually. A Chart Reader should have a ability to detect the market trend manually.

Please see the below Chart :

(Pls. click on the image to enlarge)

If you find that price is forming Higher High (HH) and Higher Low (HL) one after another, you can say it Up Trend/Bullish.

Precondition of Higher High (HH) and Higher Low (HL) : The HH or HL must be above the previous HH or HL. Please check it with the above chart. by JC

Chart of all Mutual Fund (November 3, 2011)


Sunday, November 6, 2011

Eid Mubarak


You may visit this beautiful mosque with your family. Address has been given on the picture. Happy Eid....

Sector Chart of Life Insurance (November 3, 2011)

Please see the below chart :

(Pls. click on the image to enlarge)

Bottom fisher, you may keep it in your watch list.

Saturday, November 5, 2011

Sector Chart of Tannery (November 3, 2011)

Please see the below chart :

(Pls. click on the image to enlarge)

Volume also looks good. Let's see what happen next.

Sector Chart of IT (November 3, 2011)

Please see the below chart :

(Pls. click on the image to enlarge)

Will be able to stable this time? Okay, we will observe it.

Friday, November 4, 2011

Sector Chart of Bank (November 3, 2011)

Please see the below chart. Would like to see more Green candlestick. Specially solid one. Volume support also require.

(Pls. click on the image to enlarge)

Wednesday, November 2, 2011

Chart Reading : Lesson - 2 (Part : 5)

Today, I will show you how a simple single line gives you a BUY or SELL signal. To draw this simple single line, you need not to be a TA or an Indicators Operator. If you read my previous post, I think, you've already got the point. If not, please see the below chart :

(Pls. click on the image to enlarge)
I hope the above chart is clear. Now, your job is to draw the present trend line and wait for the breakout of that trend line. Simply the best. 


If you don't know how to draw a trend line please visit the link : http://www.dse-analysis.blogspot.com/2011/10/chart-reading-lesson-2-part-2.html by JC