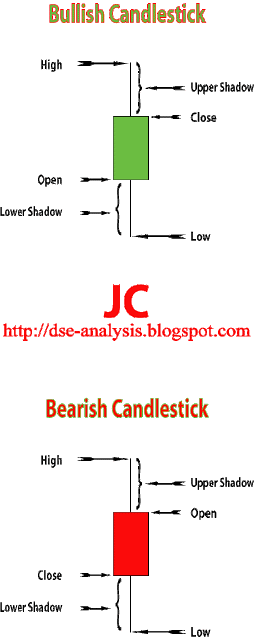
I hope now everything is clear to you. Still confused? No problem, go down.
Chart - 1
Now, pls. look at the Chart - 2 :
Chart - 2
Okay, I'm going to give a definition of the above Bearish Candlestick.
1. Open price of the share.
2. Price goes to high as buyer dominate the market. (From 1 to 2)
3. At one stage investors think that price will not go further up. So, they sell their shares. Due to the sell pressure, price goes to Low. (From 2 to 3)
4. Some investors think that price will not go more below. So, they start to buy and price goes to up and (From 3 to 4) and market time is over.
5. Lower and Upper Shadow (The outer side of Open and Close price)
One thing is missing. The shaded area i.e. the price between Open and Close is call Real Body.
I hope already you have find the difference of Bullish and Bearish Candlestick. Okay test it.
Bullish Candlestick : Open is grater than Close
Bearish Candlestick : Open is less than Close
Are you still confused? Need more easy clear definition? Okay, pls. see the Chart - 3:
Chart - 3
1. At 11:00, Open price of a share is Tk. 5.2. Investors think that price may not go up. Due to sell pressure, price goes to down at Tk. 3.
3. Some investors think that this price is the lowest price of the share. So, they start to buy shares and due to huge buy pressure price rises to Tk. 9.
4. Some investors think that price may not go further. So, they sell their shares and price come down to Tk. 7. Now, the time is 3:00 pm. Market is close.
Thanks JC.


No comments:
Post a Comment