DSEGEN INDEX (Weekly Update) : Before discussion pls see the below data :
DSEGEN INDEX:
This week average : 5780
Last week average : 5883
Difference (Point) : -183 (-1.78%)
VOLUME:
This week average : 3329737500
Last week average : 4183628000
Difference (Taka) : -853890500 (-25.64%)
If we compare this week average with last week average, we find that General Index has fall 183 point (i.e. 1.78%) and volume has also fall approx. 85 crore.
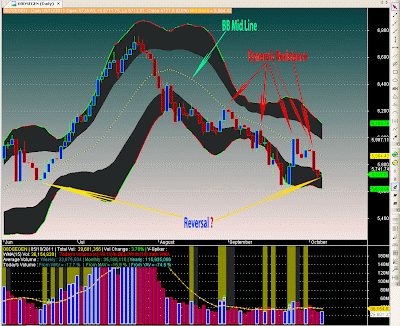
Now, please look at the Chart. Index is staying just below the BB mid line and staying at strong bearish zone. BB mid line is acted here as a dynamic resistance line. We should watch it carefully how the price break the dynamic resistance line, i.e. with large volume or not. Nearest support is around 5600.
Another one thing I have pointed in the chart. I've tried to find a similarity between last candlestick and the previous immediate reversal candlestick or it may be the continuation of p*****t trend.
If you read my last week DSEGEN INDEX (Weekly Update), you need not read the below writing except last paragraph.
What should we do now :
=> If you are a position taker, you should use your previous experience and then put your stop-loss as per your loss bearing ability.
=> If you are holding share not cash, please tighten your stop-loss. Pls. don't be emotional, be mechanical.
=> If you are holding 50-50 share and cash, pls closely monitor the market as well as tighten your stop-loss.
=> If you are holding most of your cash, I know you are well smart to know what to do. Just closely monitor the market. Whenever you will find the trend is positive, you may start to convert your cash to share as per your money management policy. Pls. don't forget to put stop-loss.
Finally, "Your money, Your decision". No need to follow others advise specially in share market. Just try to learn and use your knowledge. Your learning will lead you to success. In shaa Allah.
by JC

No comments:
Post a Comment