 |
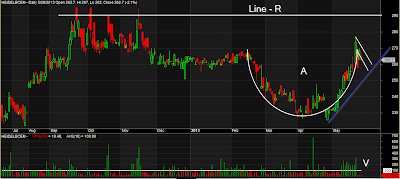
| Heidelberg Cement (HEIDELBCEM), May 28, 2013 |
Heidelberg Cement has formed a Cup and Handle chart pattern, indicated as A. We have drawn a Resistance line, indicated as Line - R. We have also drawn a average volume line, indicated as V.
After forming a successful Cup and Handle pattern, usually, price goes to up. The cup has already formed. Now, the handle is forming. Low volume is also giving a support to form a successful Handle. If everything goes fine, then there is a strong chance for uptrend and price may hit the resistance level at 290.
Sometimes handle formation takes long time. Price fall with large volume during handle formation time, it's a broken handle. I have drawn a blue line which is our support line. It will help us to identify the broken handle. Handle is another type of Pullback.
The bottom line is - Volume is the king. Present low volume is positive for handle formation. But large volume will be required when it breaks the top of the cup.
bro, is this chart adjusted?
ReplyDelete